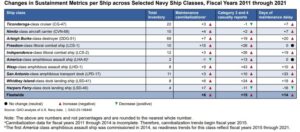
A recent Government Accountability Office (GAO) analysis found sustainment challenges worsened from 2011 to 202 over 10 ship classes.
GAO identified the worsening sustainment issues include “increasing depot maintenance delays, growing numbers of cannibalizations and casualty reports, and fewer hours that ships were steaming. Additionally, other metrics the Navy has identified as key—operational availability and materiel availability—have not been fully used to assess ship readiness.”

Maintenance cannibalization is when working parts are removed and reused due to a shortage of parts, casualty reports are of events that impair a ship’s ability to perform a primary mission, and maintenance delay days encompasses days beyond the scheduled end date for a given depot maintenance period.
The analysis, published Jan. 31, reviewed sustainment metrics on Ticonderoga-class cruisers(CG-47), Nimitz-class aircraft carriers (CVN-68), Arleigh Burke-class destroyers (DDG-51), Freedom-variant Littoral Combat Ships (LCS-1), Independence-variant LCS (LCS-2), America-class amphibious assault ships (LHA-6), Wasp-class amphibious assault ships (LHD-1), San Antonio-class amphibious transport dock ships (LPD-17), Whidbey Island-class dock landing ships (LSD-41) and Harpers Ferry-class dock landing ships (LSD-49).
Specifically, GAO said program offices for nine of the 10 ship classes “indicated they faced challenges obtaining spare parts, which has resulted in an increase in ship maintainers reusing parts because new parts are not available. We found that the average number of maintenance cannibalizations per ship rose by about six cannibalizations across the ship classes we examined from fiscal year 2015 through 2021.”
However, while the average number of cannibalizations per ship increased every year from 2015 to 2021, it did not report cannibalization rates for FY 2011 – 2014 because that data is incomplete.
Navy officials told the GAO these increases were often driven by supply chain shortfalls for specific parts.
“According to these officials, decisions to move parts from one ship to another are made when the supply of a specific part will not meet the operational commitments of a ship. Officials further noted that the specific increase is difficult to quantify but challenges with parts availability have been a specific driver for the increase.”
Officials said surface ships in particular have experienced an increasing number of cannibalizations over the past years, exacerbated by the COVID-19 pandemic.
“Parts obsolescence, diminishing manufacturing sources, and material shortages are common issues. According to Navy officials, since the pandemic started, supply chain slowdowns have also become more common, resulting in increased procurement and manufacturing lead times to obtain needed parts,” GAO said.
Only America-class ships had fewer cannibalizations in 2021 than it had in 2015. Meanwhile, Nimitz-class carrier officials told GAO their cannibalizations are driven by combat system-related equipment that has many older parts no longer produced by manufacturers.

“Officials explained that manufacturers for these parts require demand to continue to produce the parts, and it is not economically feasible for them to remanufacture until they receive this demand. According to Navy officials, to mitigate the issue the Navy established an obsolescence working group that analyzes part failures to determine which parts fail most often based on previous history,” the report said.
The report also found the average number of category three and four casualty reports per ship increased by 15 from FY 2011 to 2021.
GAO said the Navy’s categorization of casualty reports “tends to be subjective or based on other factors than the severity of the defect, such as, according to maintenance officials, communicating a maintenance priority. In other words…there are additional deficiencies that could be mission-critical that may not be captured by category 3 or 4 casualty reports.”
Eight of the 10 ship classes GAO analyzed had increases in category three and four casualty reports from 2011 to 2021, with the most significant increases on the Wasp-class and both LCS variants, at 43 and 26, respectively.
GAO said Navy officials explained the increases in category three casualties could be subjective since they are sometimes categorized at a higher level “ because the ship personnel reporting the casualty think they will get parts and assistance sooner based on the higher categorization.”
Some types of casualties might also be categorized differently based on ship location, with Navy officials giving the example of a radar failure on a carrier in U.S. waters might be called a category two while the same failure overseas would be classified as category three.
GAO also reported the average days of depot maintenance delays per ship increased by about five days per ship to an average of 19 days total per ship from 2011 to 2021.
FY 2019 had the highest number of delay days per ship, at an average of 40 days per ship, but the number fell in 2020 and 2021. Notably, the DDG-51 class had an average of 26 days of depot maintenance delays and LPD-17 averaged over 30 days of depot maintenance delays in FY ‘21, while both LCS variants had no depot maintenance delays in FY ‘21.
Navy officials told GAO their goal was to have no depot maintenance delay days, but the average number of delay days per ship was 18 in 2021, almost four times the average of five days in 2011.
GAO argued while the Navy has improved its ability to track ship sustainment data at the system level, “it has not used these data to assess ship readiness in line with operational and materiel availability objectives even though DoD and Navy guidance identifies operational availability as a primary measure of readiness for weapon systems and equipment and officials indicated that this was the case for materiel availability as well.”
Officials told GAO that compiling system-level data into aggregate availability metrics through a ship lifecycle is still a Navy objective, but admitted it is a “significant challenge.”
GAO also found O&S costs increased by about $2.5 billion, or 17 percent, from FY ‘11 to ‘20. This included $1.2 billion (24 percent) in increased maintenance costs while the Navy added 33 ships in these 10 classes, of a 28 percent ship count increase.
While O&S costs varied across the ship classes due to the differing numbers of ships per class, GAO analyzed total costs for each class and costs per ship and found steaming hours declined even though ship numbers increased.
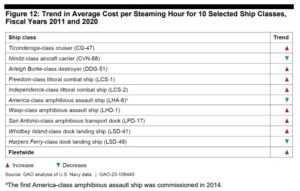
“Therefore, the cost per steaming hour for the ship classes we examined increased in total with some variation across the examined ship classes. Generally, the increase in cost per steaming hour for the ship classes we examined means the Navy is spending more to operate and sustain the ships for each hour of operational activity,” GAO said.
The report found only the Nimitz-class, America-class, and Harpers Ferry-class ships did not undergo an increase in cost per steaming hour.
The other seven classes had increased costs per steaming hour when comparing FY 2011 to 2020. However, GAO did not disclose the specific number of steaming hours “because DoD deemed this information sensitive,” the report said.
GAO warned that as overall steaming hours generally decrease and total O&S costs increase, steaming hours have become more expensive.
That trend is “likely to continue. We have reported that operating costs for classes included in our review are likely to continue to increase.”
The report also argued this increase in O&S costs per steaming hour over time has “resulted in worsening ship conditions and increased costs to repair and sustain ships. GAO has made dozens of recommendations, which the Navy has generally concurred with, to improve the Navy’s sustainment of its ships. “
GAO said the Navy has taken actions, but it has still has not fully implemented many of GAO’s recommendations.